
How many people reached each step, tapped each button and answered each question.
Step 1
Open a live flow
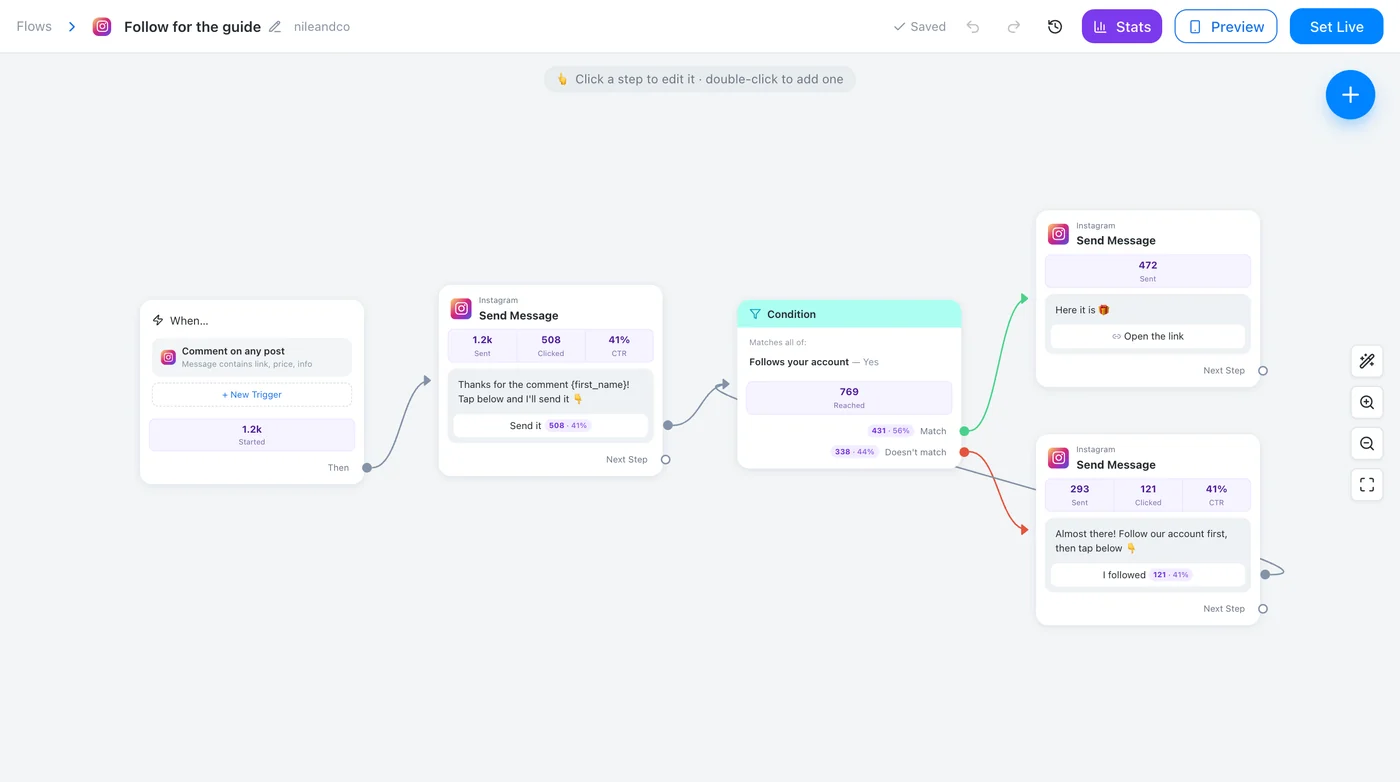
Once a flow has been live, every box shows its numbers and “Stats” in the top bar switches them on and off. They refresh every minute.
Step 2
What each number means
“When…” counts the people who started the flow. A message shows how many it was sent to, how many tapped (“Clicked”) and the click rate; each button and quick reply carries its own count and share. A question shows how many answered, and its “If no reply” line how many didn't. A condition or randomizer shows how many went each way; a smart delay, how many are waiting now and how many have passed.
Step 3
Use them to improve the flow
A message with many sends and few clicks needs a clearer button; a question many people leave unanswered is asking too much too early. Test two versions with a randomizer and keep the one that wins.
Worth knowing
- The numbers count from the day stats arrived (5 October 2026); the flow's total runs are on the Flows page.
Was this article helpful?